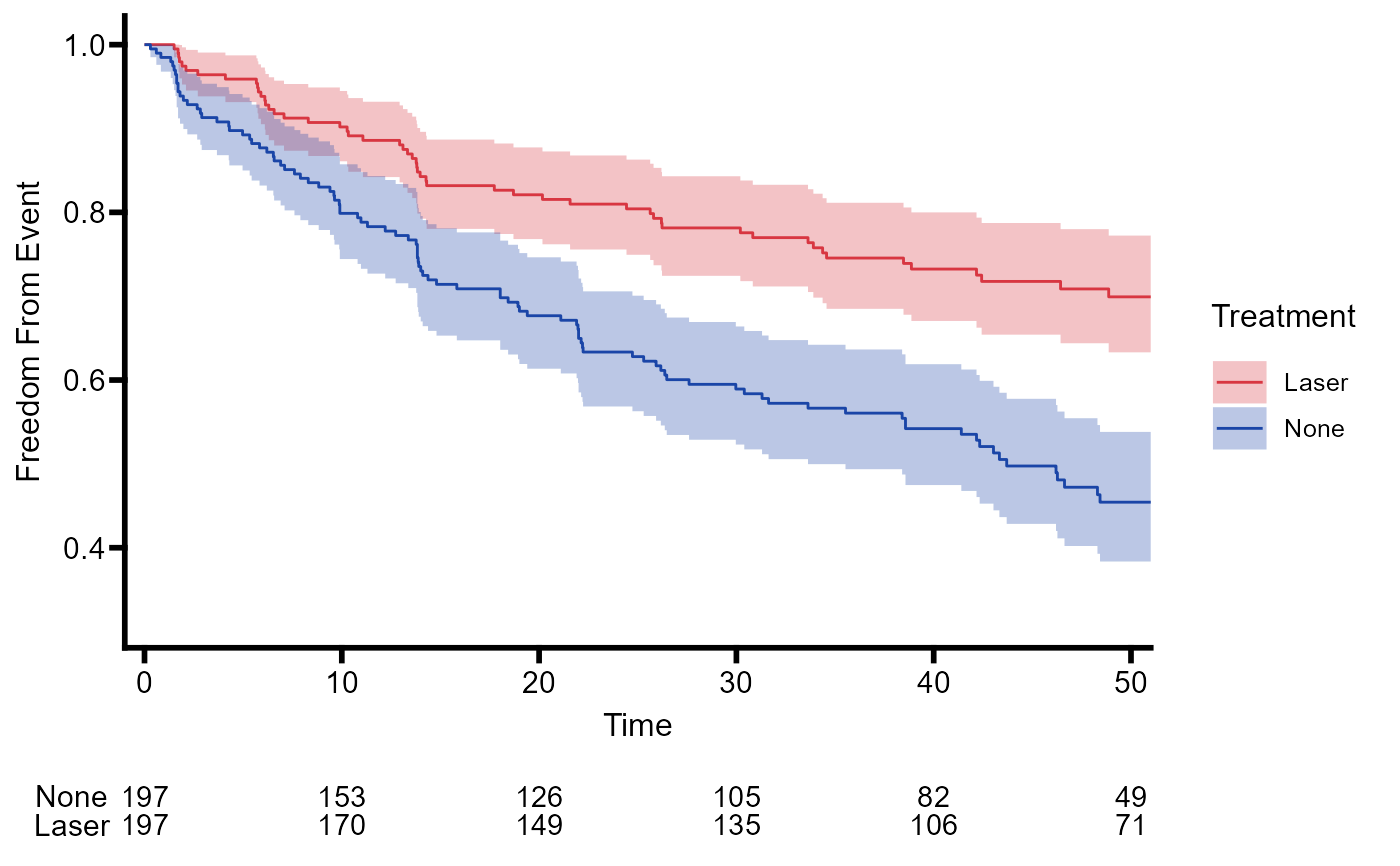
Aligns axes and combines a ggplot2 plot and table into a single plot. Can handle legends.
Usage
append_table(
  plot = NULL,
  table = NULL,
  plot.height = 1,
  table.height = 0.1,
  plot.width = 1,
  legend.width = 0.2,
  legend.offset = -15
)
Arguments
- plot
A ggplot2::ggplot() object. If a legend is present, it will be extracted.
- table
A ggplot2::ggplot object. If a legend is present, it will be removed and ignored.
- plot.height
A numeric. Height of plot relative to table. Defaults to 1.
- table.height
A numeric. Height of table relative to plot. Defaults to 0.1.
- plot.width
A numeric. Width of plot relative to legend. Ignored if no legend present in plot. Defaults to 1.
- legend.width
A numeric. Width of legend relative to plot. Ignored if no legend present in plot. Defaults 0.2.
- legend.offset
A numeric. Vertical offset of legend box. Used to raise or lower. Ignored if no legend present in plot. Defaults to -15.
Value
A ggplot2 tableGrob object. Use grid::grid.draw() to open in RStudio viewer. Works with ggplot2::ggsave() out of the box.
Examples
library(survival)
library(ggplot2)
library(grid) # grid.draw() finished plot

# Data with group names specified
data_diabetic <- diabetic
data_diabetic$trt <- as.factor(data_diabetic$trt)
levels(data_diabetic$trt) <- c('None', 'Laser')

# Survival Model
fit <- survfit(Surv(time, status) ~ trt, data = data_diabetic)
fit <- survfit0(fit)

# Kaplan Meier (KM) Plot
plot_km <- ggplot(
 data = data.frame(
  time = fit$time,
  surv = fit$surv,
  conf.low = fit$lower,
  conf.high = fit$upper,
  strata = rep(names(fit$strata), fit$strata)
 ),
 mapping = aes(x = time, y = surv)
) +
  geom_step(aes(color = strata)) +
  geom_stepconfint(aes(ymin = conf.low, ymax = conf.high, fill = strata), alpha = 0.3) +
  coord_cartesian(c(0, 50)) + # Note scale set here!
  scale_x_continuous(expand = c(0.02,0)) +
  labs(x = 'Time', y = 'Freedom From Event') +
  scale_color_manual(
    values = c('#d83641', '#1A45A7'),
    name = 'Treatment',
    labels = c('Laser', 'None'),
    aesthetics = c('colour', 'fill')) +
  theme_basic()

# Risk Table
tbl_risk <- ggrisktable(fit, c(0, 10, 20, 30, 40, 50)) +
  coord_cartesian(c(0, 50)) +
  scale_x_continuous(expand = c(0.02,0)) +
  theme_risk()

# Combine KM plot and risk table
plot_cmbd <- append_table(
  plot = plot_km,
  table = tbl_risk
)

# Draw in RStudio viewer
grid.newpage()
grid.draw(plot_cmbd)
